

For investment bankers, I know how important it is to make informed decisions when it comes to managing portfolios. That's why digital twin and data analytics have become essentials for investment banks. By translating investment portfolios' replicas into data, we can gain valuable insights into market trends, risk factors, and other key indicators that help make better investment decisions.
Digital twin simulates portfolios by using advanced mathematical algorithms and modeling techniques. We can simulate the performance of different investment portfolios in different scenarios and under different market conditions, answering to the question "what if?". This helps understand which strategy will best deliver ROI.
In the graph below, we see an example about the probability of profit and loss during 4 years for one of the assets we were monitoring, where y is the revenue of the asset, n is the working capital reserve, P0 is the actual level of risk and P(E) is the probability to achieve optimal EBITDA margin.
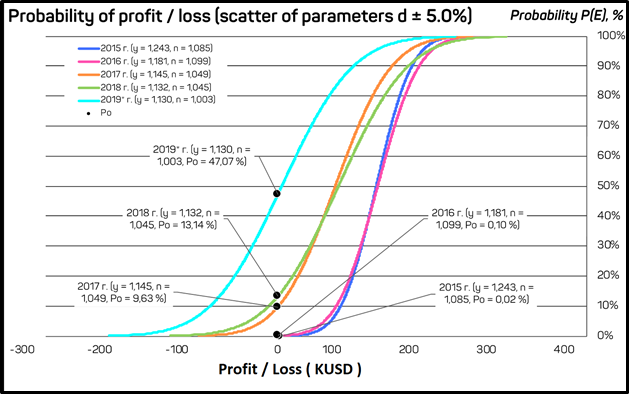
We see that during 2 first years, 2015 and 2016, the asset performs well and the actual risk of loss is almost negligible, in parallel the probability of profit and reaching a good EBITDA margin is higher - and therefore as there were no losses, the working capital reserve wasn't used.
Losses have been observed starting from the coming years. From 2017, the asset has lost around 100k from its value comparing to the previous years, the speed and probability of regaining the EBITDA margin and getting profit became lower, as the level of risk P0 indicates, which is considerably higher than in the last 2 years. The asset had to use its capital reserves to recover losses and expenses, as the n value, which is decreasing in the graph, shows.
Losses have been observed starting from the coming years. From 2017, the asset has lost around 100k from its value comparing to the previous years, the speed and probability of regaining the EBITDA margin and getting profit became lower, as the level of risk P0 indicates, which is considerably higher than in the last 2 years. The asset had to use its capital reserves to recover losses and expenses, as the n value, which is decreasing in the graph, shows.
In 2019, the financial performance of the asset has unfortunately continued to decrease due to a poor quality of management and decisions made during the year, and the probability of reaching the good EBITDA margin became less, as the actual risk value P0 reflects, thus many decisions could be taken into consideration by testing different scenarios, should we (reevaluate the asset? reinvest more in the asset? diversify investments? ...etc.)
In the case of a diversified portfolio for example, based on the asset production model, and data analytics, an optimal strategy for managing turnover and dividends, and dividing profit between each asset can lead to increase of ROI and for a better performance of the portfolio.
In the case of a diversified portfolio for example, based on the asset production model, and data analytics, an optimal strategy for managing turnover and dividends, and dividing profit between each asset can lead to increase of ROI and for a better performance of the portfolio.