

Developing software to improve the effectiveness and efficiency of management decisions
About the product
Digital Twin of a City software
The Digital Twin of a City software is a system for managing territorial development based on assessments and forecasts. It links the dynamics of baseline and target indicators across time, space and industries. The system is built top-down — from the development goals of a territory to individual objects and entities. Detailing the indicators ensures the integrity of the parameters of management decisions and is delivered through standard mechanisms of territorial management.
Key tasks
Monitoring and managing infrastructure
Providing a subscription to data on the socio-economic development of territories in Russia and worldwide
Analysis and planning of production capacity
Improving management and decision-support systems
Assessing capital investment in the development and reconstruction of fixed assets
Monitoring and managing risks
Forecasting the socio-economic development of territories using mathematical models
Users and their goals
City administration leadership
- Population growth and well-being
- Long-term development planning
- Budget allocation
Planning and analytics services of the city and the bank
- Collecting statistics
- Identifying bottlenecks that hinder development
- Assessing the investment potential of an industry or project
Planning and analytics services of a developer
- Assessing the development prospects of territories
- Assessing the investment potential of a territory or project
- Maximizing project profit
Capabilities of the Digital Twin of a City software
Monitoring of city development
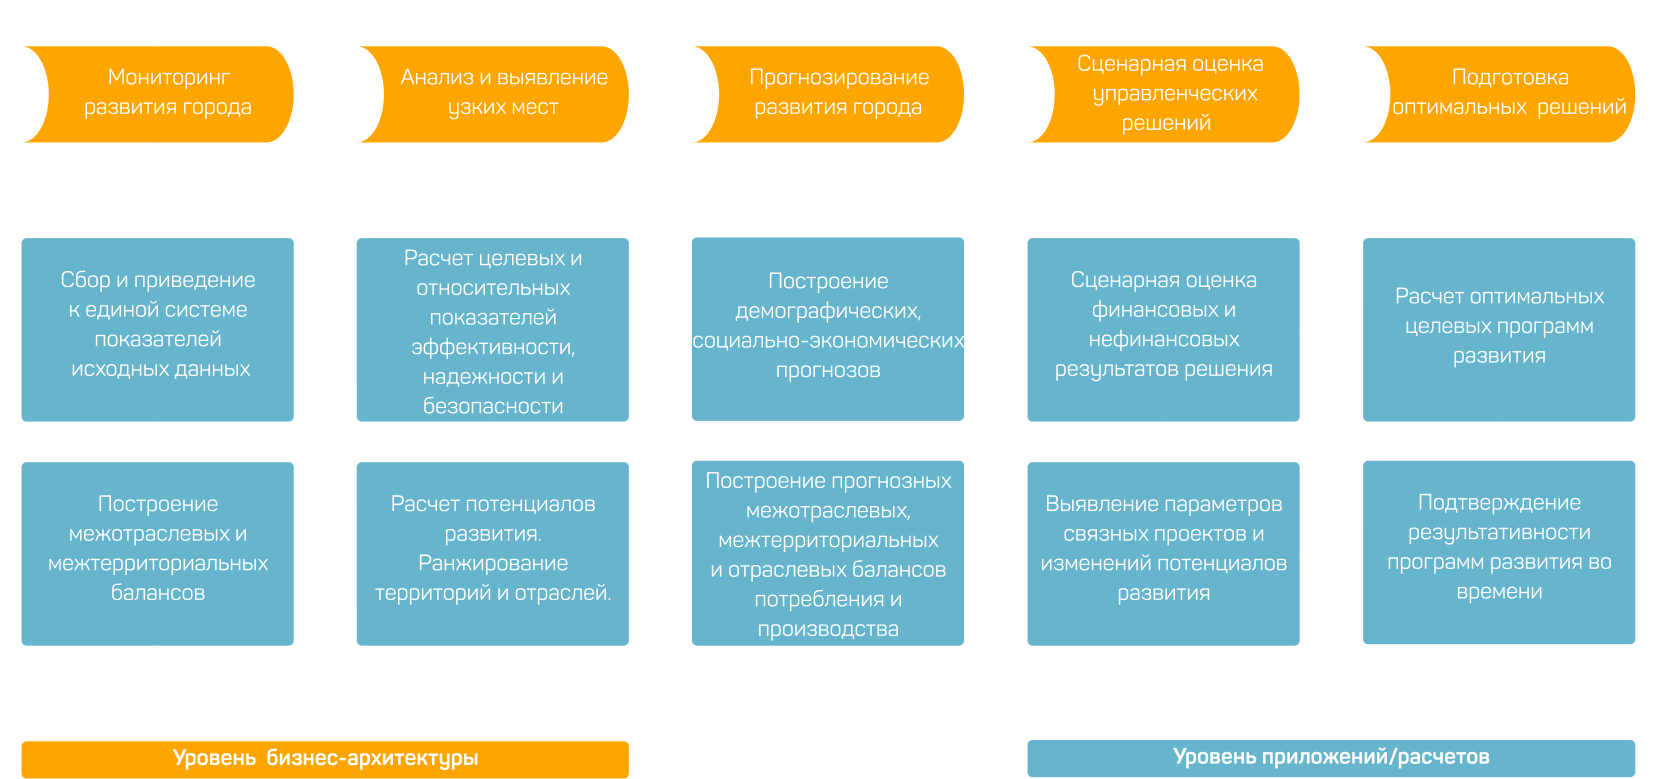
Monitoring of territorial development includes collecting raw data from open and restricted (NDA) sources, processing and analyzing it, and bringing it to the city's reference system of indicators and measurements.
Analysis and identification of bottlenecks
Analysis of the efficiency, reliability and safety of the city's services and/or systems. Identification of obstacles to the growth of indicators. Comparative analysis of city development indicators to determine growth potential.
Scenario assessment of management decisions
Assessment of the socio-economic consequences of management decisions (investment projects, programs, schemes and budget decisions) within a territorial approach.
Preparation of optimal decisions
Optimization of parameters and programs of management decisions. Formation of decision portfolios to maximize results under limited costs.
Functional architecture
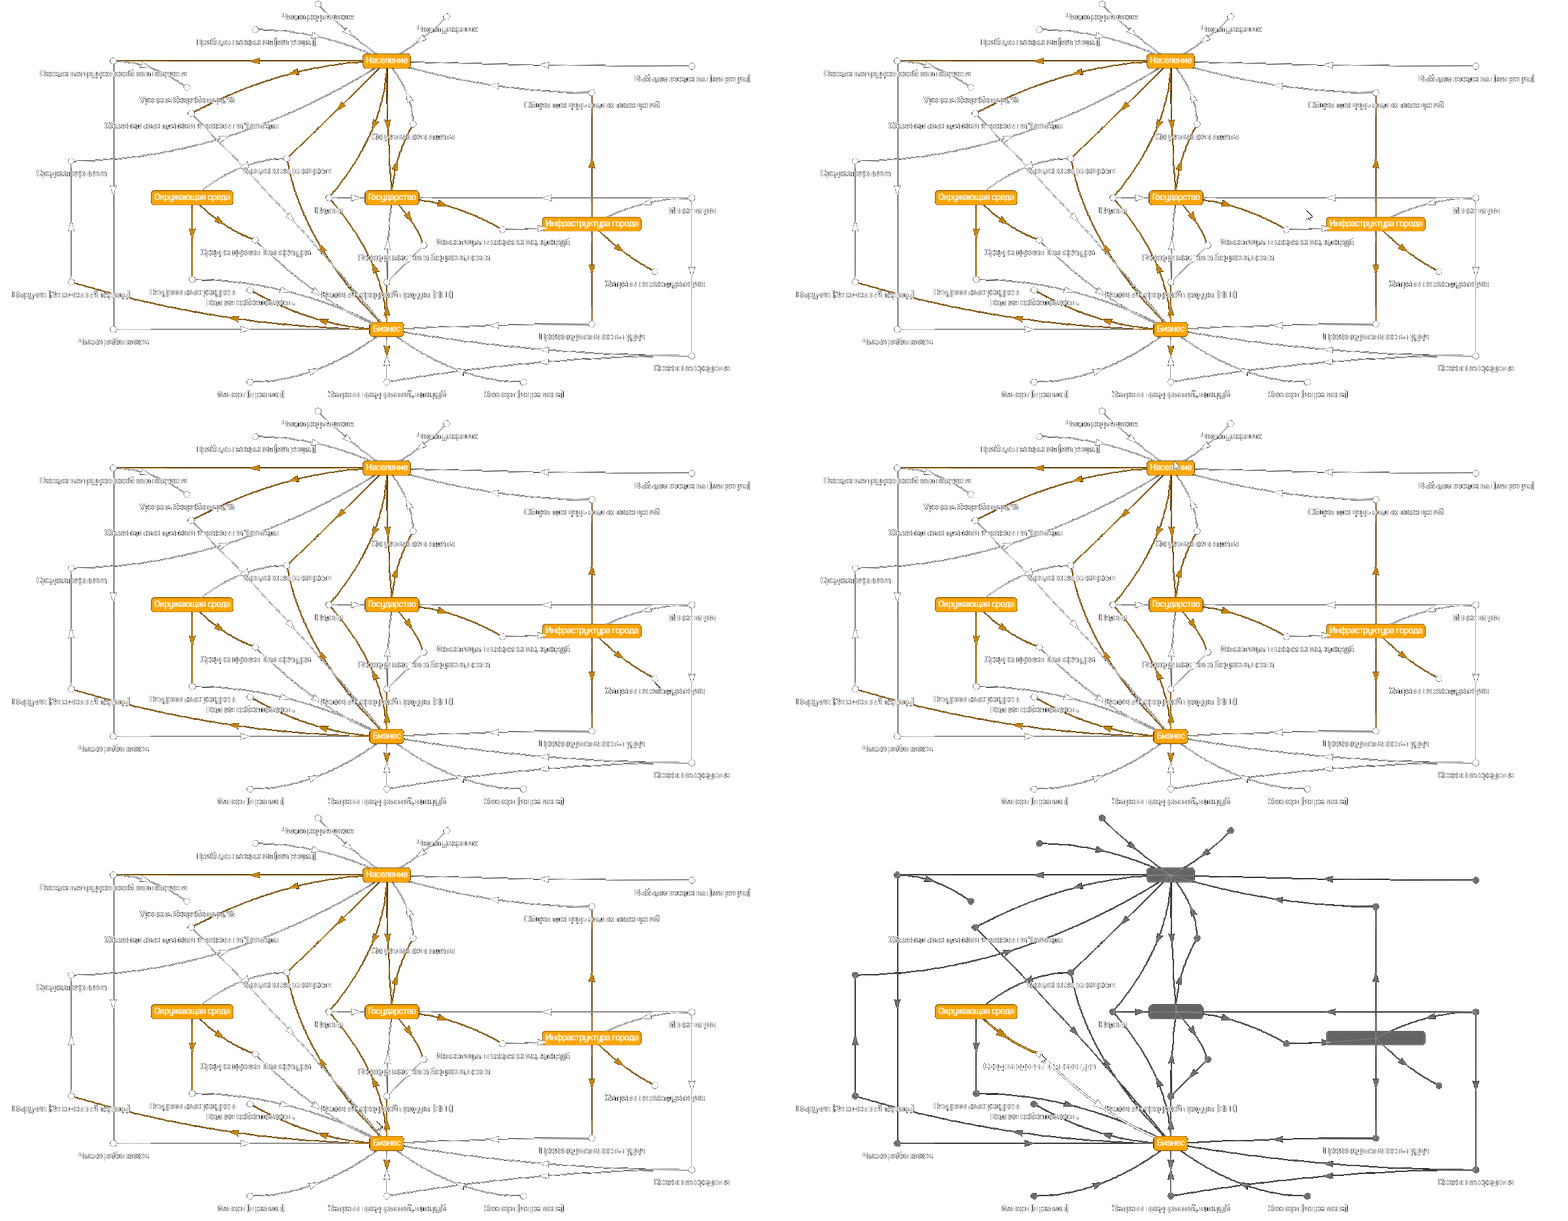
The pipeline software provides functions for collecting, cleaning and standardizing data for territorial monitoring and balance calculation. It also provides mathematical models for forecasting the development of a region or industry. The software supports analysis of the key indicators of socio-economic development and the evaluation of projects.
More about the processing pipeline
The pipeline is designed to collect, process and analyze data on city development using mathematical models. It ensures the transparency and traceability of data at every processing stage, as well as the integrity and completeness of output indicators. The pipeline also complies with balance relationships and is used to prepare management decisions.
Data collection and processing
All the mathematical models that have been developed use official open and restricted (NDA) data sources. They were selected based on their relevance to forecasting models and their reliability.

10
Typical development scenarios + on request
494
Indicators
128
Industries
91M
Time series
25k
Territories
List of models
Mathematical models are tools that help us understand and solve problems in various fields. All models are part of an integrated model of the city.
Macroeconomic models
- City development simulator: assessing the impact of investment projects on city development
- Demographic model: forecasting population dynamics, birth rate, mortality and migration
- Socio-economic model of national goals: scenario forecasting of income/expenditure and quality of life
Inter-industry and industry models
- Input-output balance model and supply-demand models:
- Assessment of deficits and surpluses and of supply and demand
- Assessment of exports-imports, output-costs, capacity-load
- Assessment of the efficiency and effectiveness of government regulation and measures
- Agglomeration model and inter-territorial balance model:
- Assessment of commuter migration
- Assessment of the load and demand on infrastructure
- Formation of transport system development plans
- Transport and economic balance:
- Assessment and forecast of the state of the transport sector
- Identification of ways to improve the economic efficiency of public transport
- Justification of the parameters of transport reform and management decisions
- Fuel and energy balance
- Receivables for utility resources and services:
- Assessment of the causes of receivables
- Reducing the growth rate of receivables
- Calculation and assessment of resource-supply risks for territories:
- Distribution of the risks of guaranteed heat supply
- Assessment of probable resource losses in water supply, water disposal and heat-supply systems
Simulation and optimization models
- Heat supply, water supply and water disposal model:
- Development of optimal modes and programs, justification of scheme-adjustment parameters
- Reducing the cost of maintaining a given indoor temperature
- Pipeline failure assessment:
- Assessment of the terms and conditions of safe operation of pipelines of corporate networks and utility systems
- Reducing the accident rate and the cost of network ownership
- Optimization of consolidated cargo transportation: reducing costs under given delivery-time constraints
User scenarios
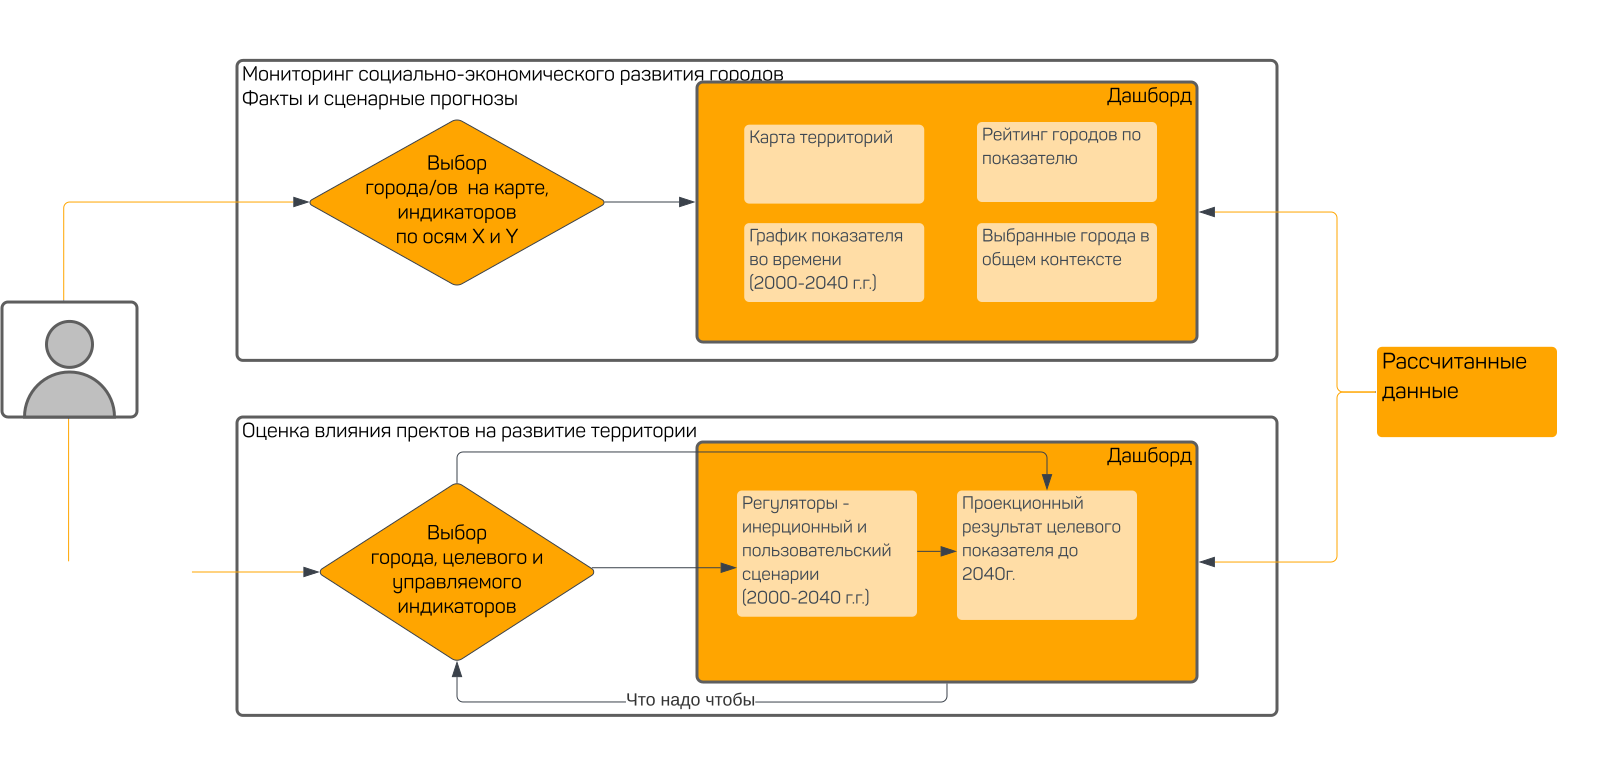
The dashboard website provides a map of cities accompanied by facts, information about infrastructure objects and development charts. Data is searched through a search bar. You can study demographic indicators, inter-industry and inter-regional balances, compare regions and run a what-if analysis to find the optimal solution.
Featured solutions
If our toolkit does not yet include a model for your task, we will develop it, find the optimal solution and provide an evidence base.
Investment forecasting service
Advanced data analysis methods to help investors make informed decisions. It reveals the dependence of investments on ESG.
Digital twin of production
An interactive analytical platform for analyzing production bottlenecks. Prices, capacity structure, production and financial models.
Fuel and energy balance
A modeling system for scenario analysis of the dynamics of the multi-level fuel and energy balance of the world, a country and its regions.
City model
A comprehensive mathematical model of the urban economy for identifying bottlenecks and optimizing resource-supply schemes.
Digital twin of engineering networks
A comprehensive infrastructure modeling tool that assesses and forecasts the failure time of physical assets.
Deployment architecture
The user interface is an interactive web page / dashboard that optionally contains a map of cities, several types of charts and tabular data, and a settings panel. It includes stands / dashboards tailored to a specific task: the Smart City panel, City Ecology, Fuel and Energy Balances, the Financial Calculator and Enterprise Production Flows.
Contact us
Access to the Digital Twin of a City software suite is provided on a commercial basis. Pricing is calculated individually based on the client's needs.
Project examples
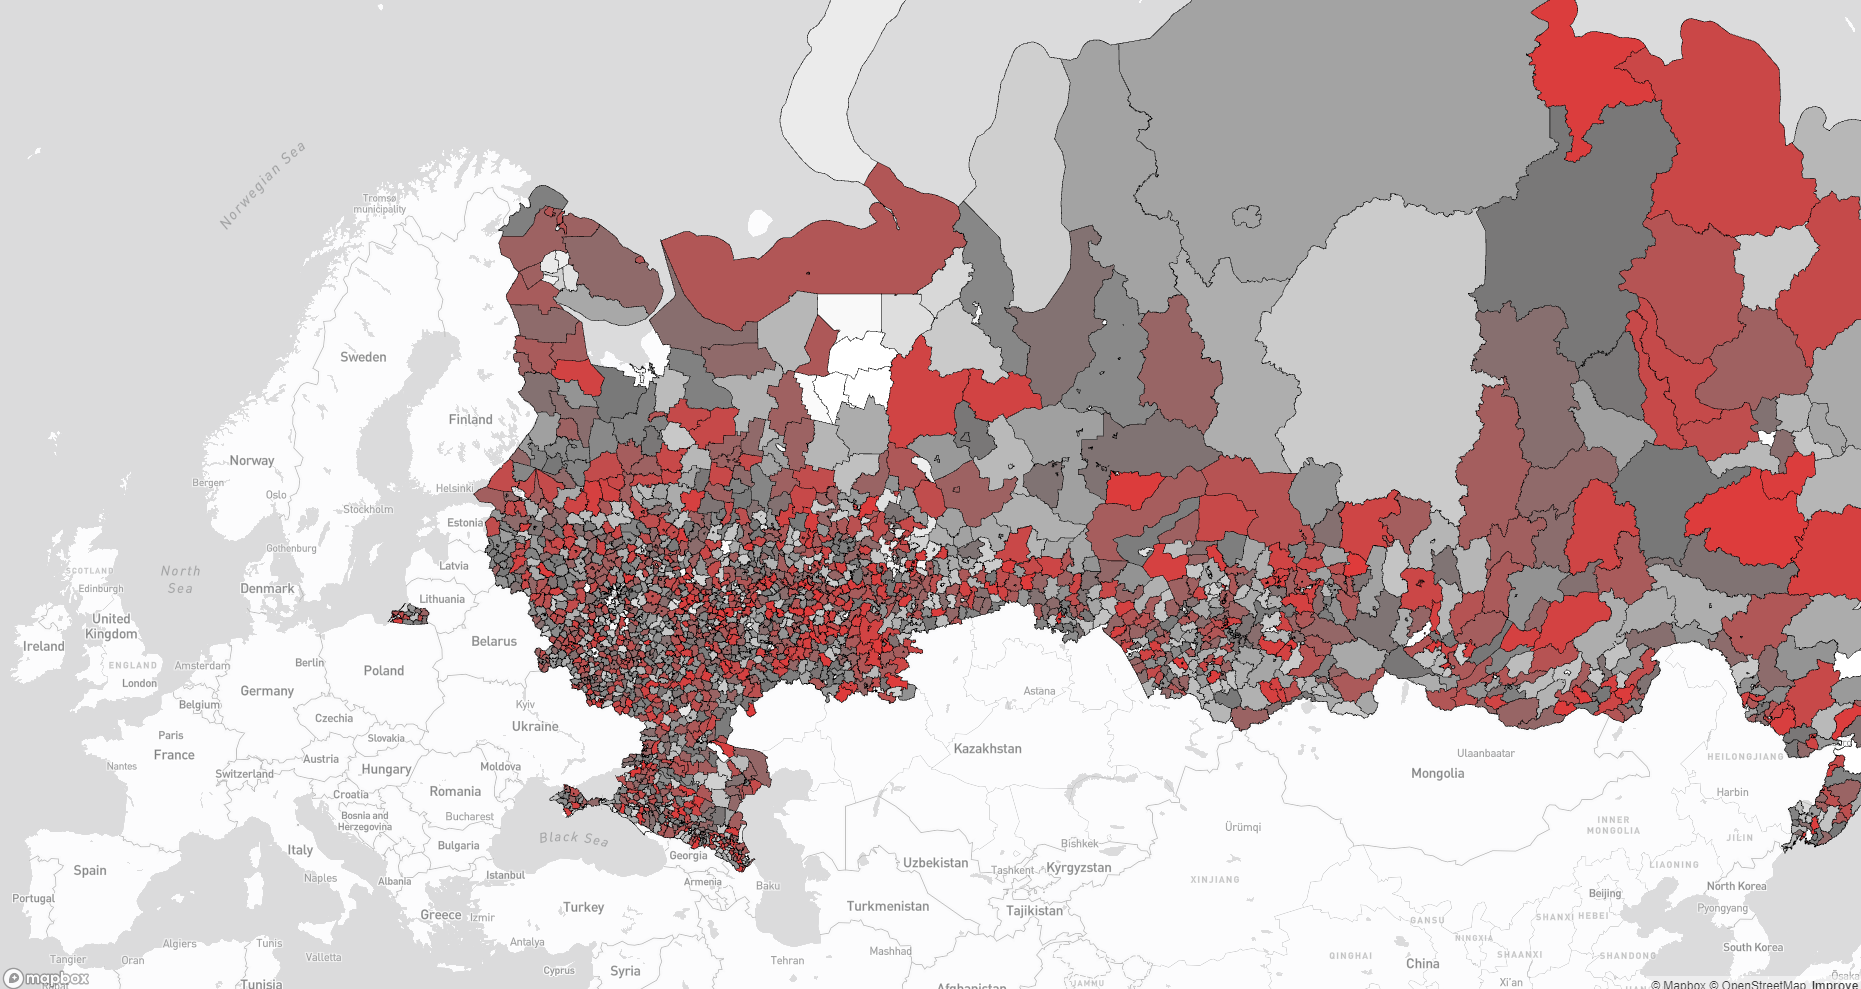
Geoanalytics system for a major investment fund
A geoanalytics system aimed at identifying investment potential for industrial and social development of cities, and assessing the impact of investment projects on socioeconomic development. The system monitors around 300 indicators across 5,000 locations worldwide, across 128 industries and socioeconomic categories, with a planning horizon of up to 50 years.
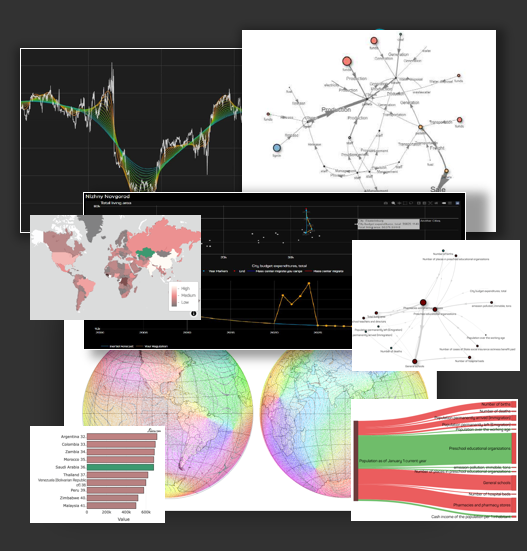
Investment portfolio digital twin
An investment forecasting service uses advanced data-analysis methods to help investors make informed decisions. It identifies how investments depend on ESG factors, enabling more accurate forecasts. The service helps find optimal dividend-distribution and capital-turnover strategies, and identifies operational inefficiencies and investment opportunities. Using inter-industry equilibrium models, the service forecasts asset prices and volumes from market data — a powerful tool for investors seeking to make data-driven decisions and maximize returns.
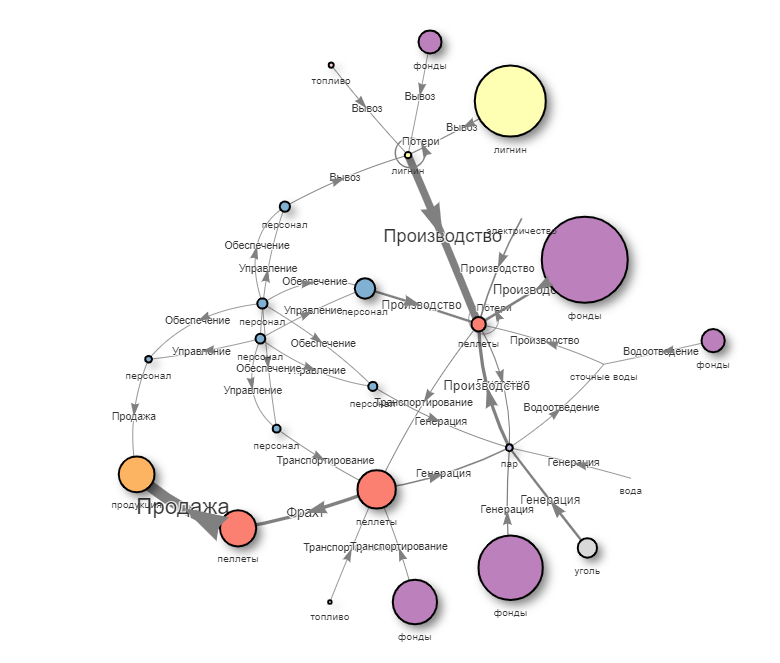
Production digital twin
Part of an interactive analytics platform for identifying production bottlenecks. Product pricing, production-capacity structure, and planned production and financial models were all factored in and brought together in a single view.
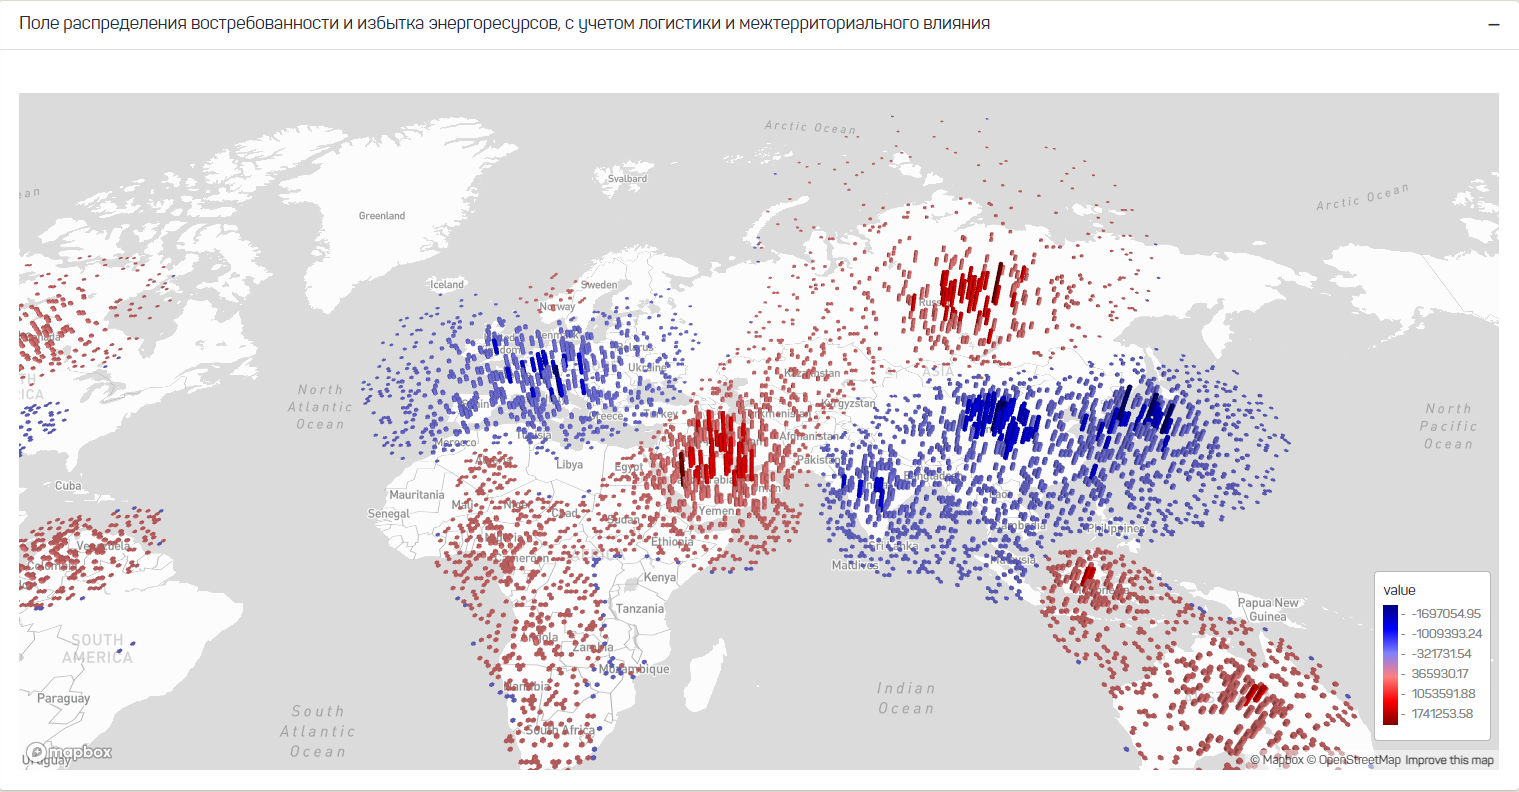
Fuel and energy balance
A modeling system that runs scenario analysis of multi-level fuel and energy balance dynamics for the world, a country, regions, or municipalities.
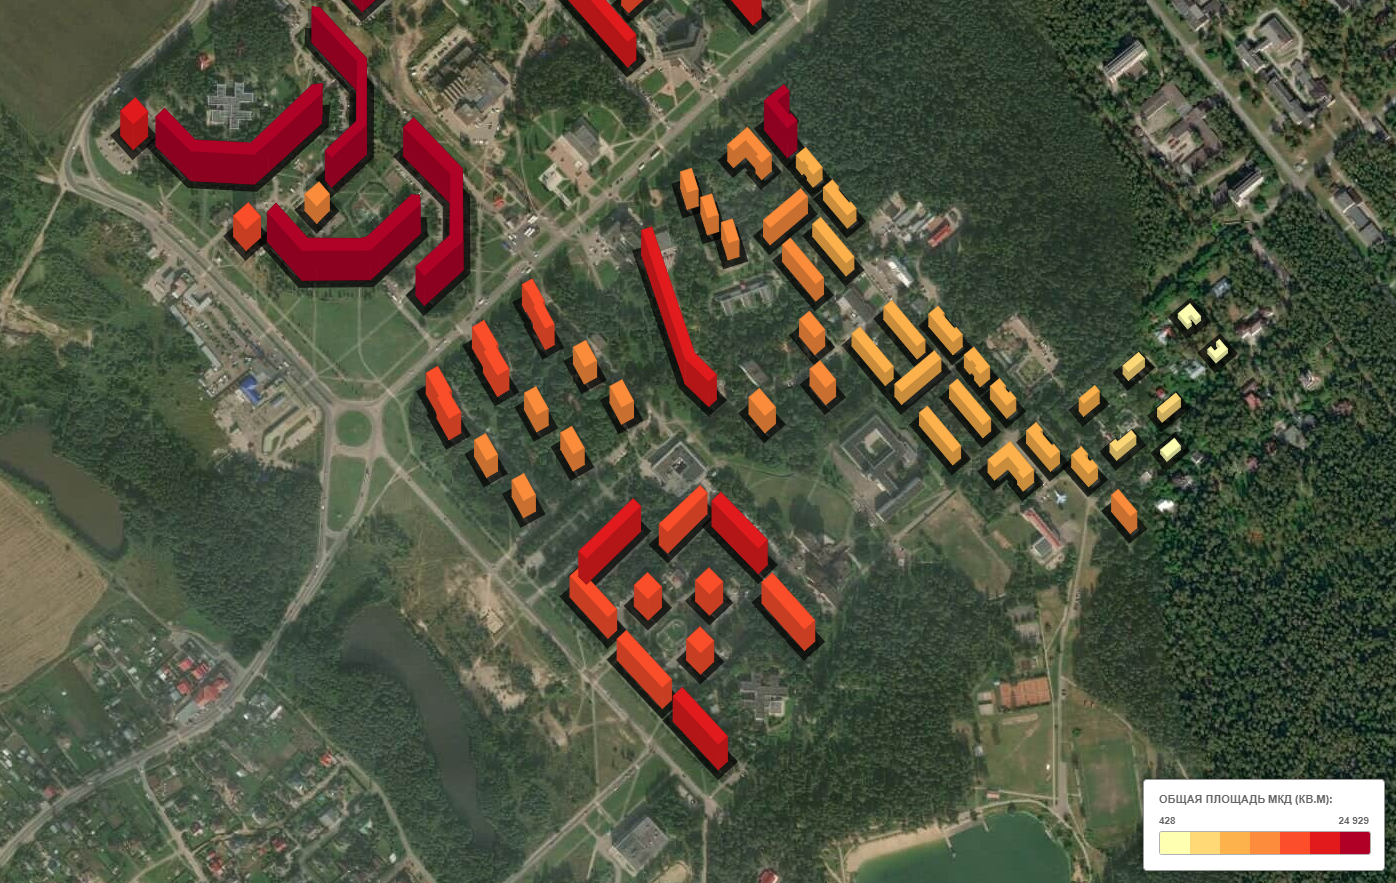
City model
A comprehensive mathematical model of city infrastructure that identifies bottlenecks causing loss of operational and technical resources, optimizes utility-supply schemes and area improvement, and shapes a comprehensive development program.
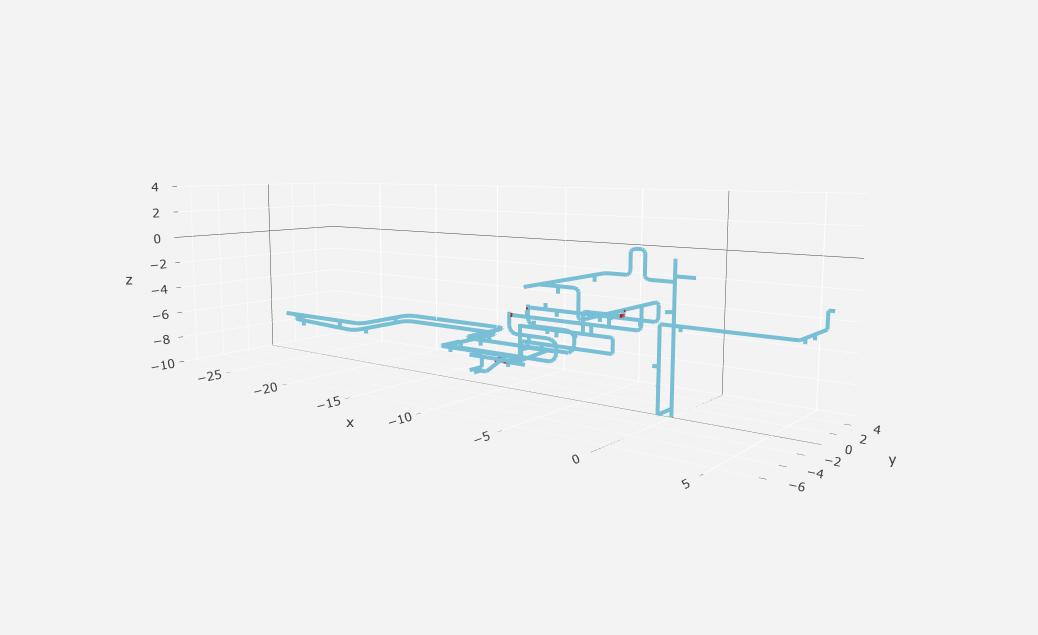
Utility network digital twin
A comprehensive infrastructure modeling tool that assesses and forecasts the failure time of physical assets, particularly pipeline infrastructure. It was developed in response to the deterioration of assets built between the 1950s and 1980s and growing operational risks. Time-to-failure is the key metric used to assess structural behavior. The service accounts for defect data, operating conditions, and environmental factors. It also visualizes assets through a 7D model and provides open specifications and documentation. The digital twin helps reduce risk and ensures asset safety and reliability.
If we don't yet have a model for your task, we'll develop one and find the optimal solution
Get a tailored solution
Request a proposal
Describe your task and leave a contact — we'll clarify the details and prepare a tailored proposal.